
看了这个视频,决定实现一个类似的效果。
跑了50000位,完整视频:https://youtu.be/aHvkQXpwkU0
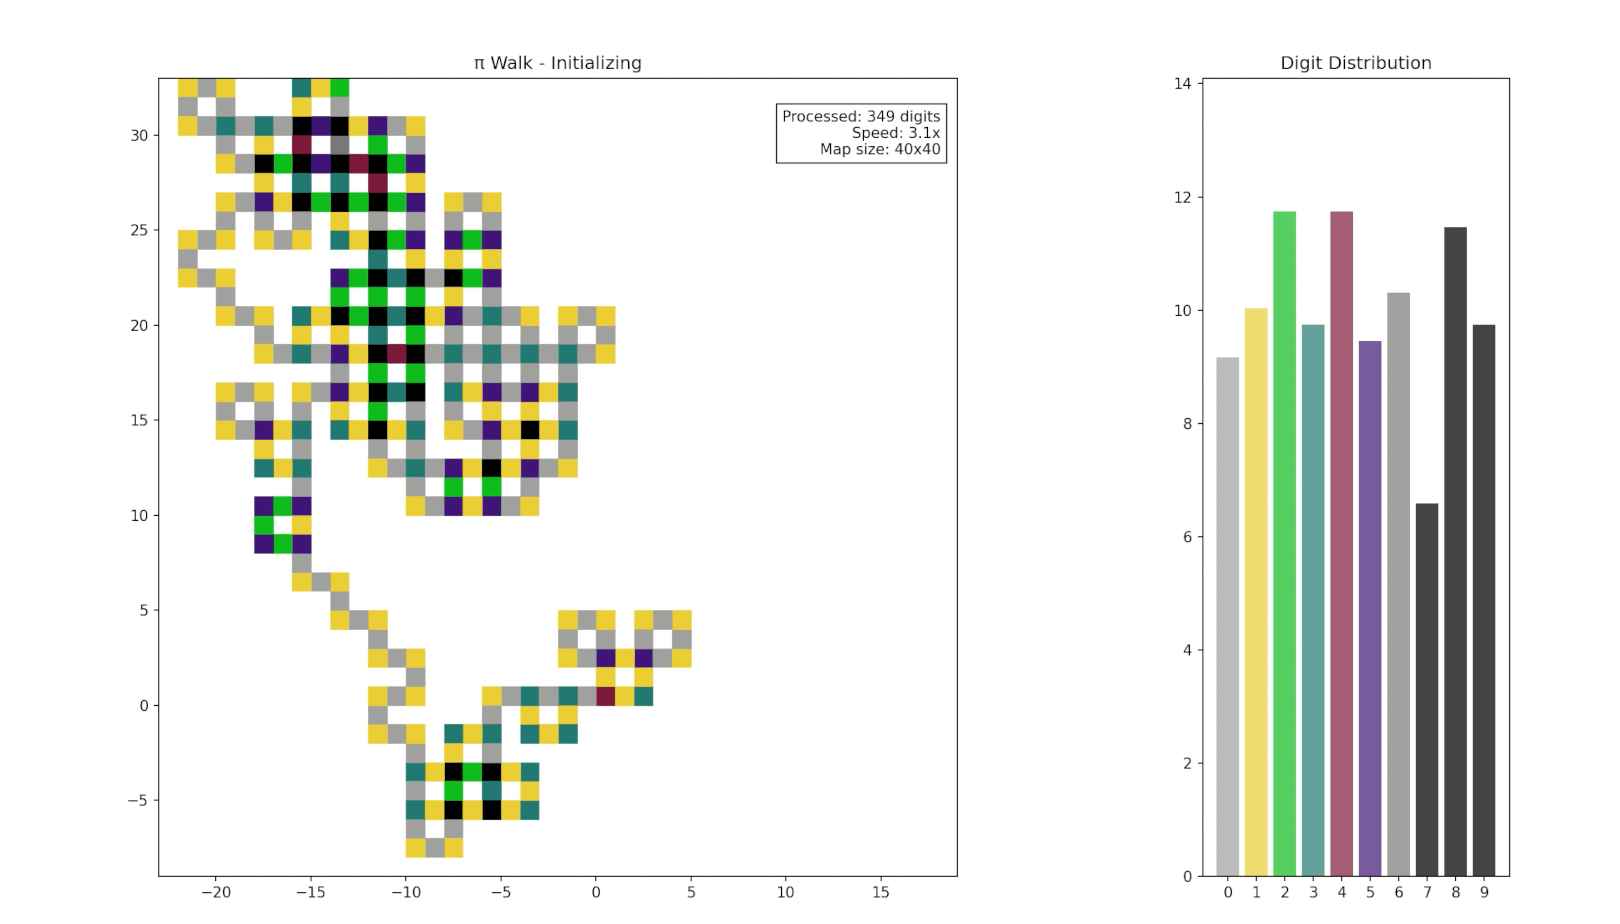
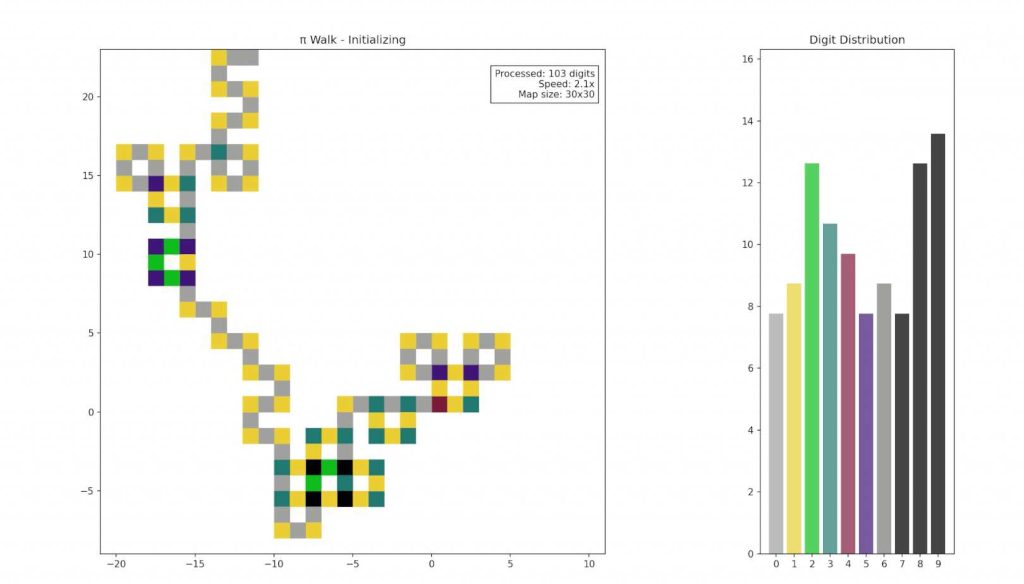
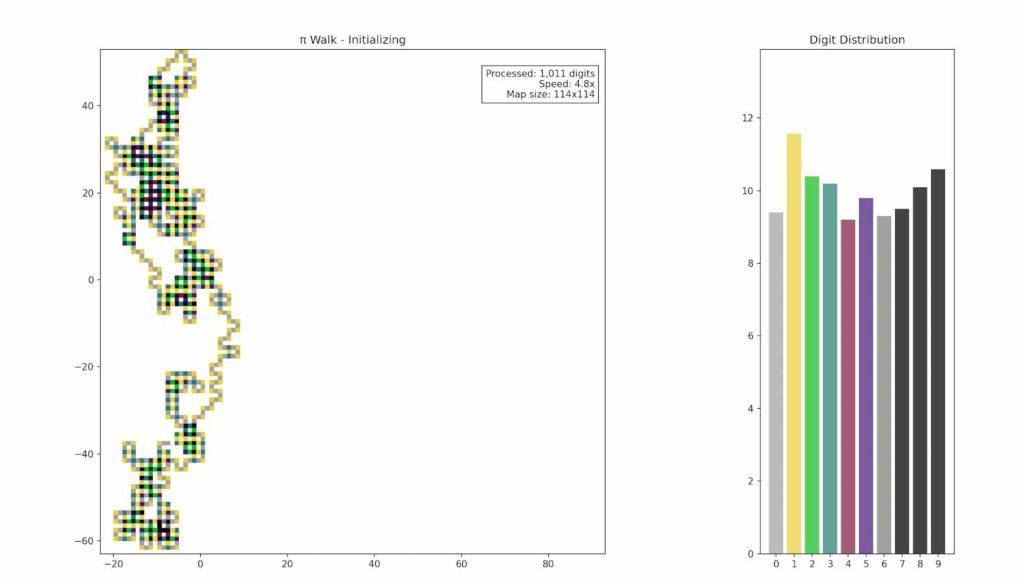
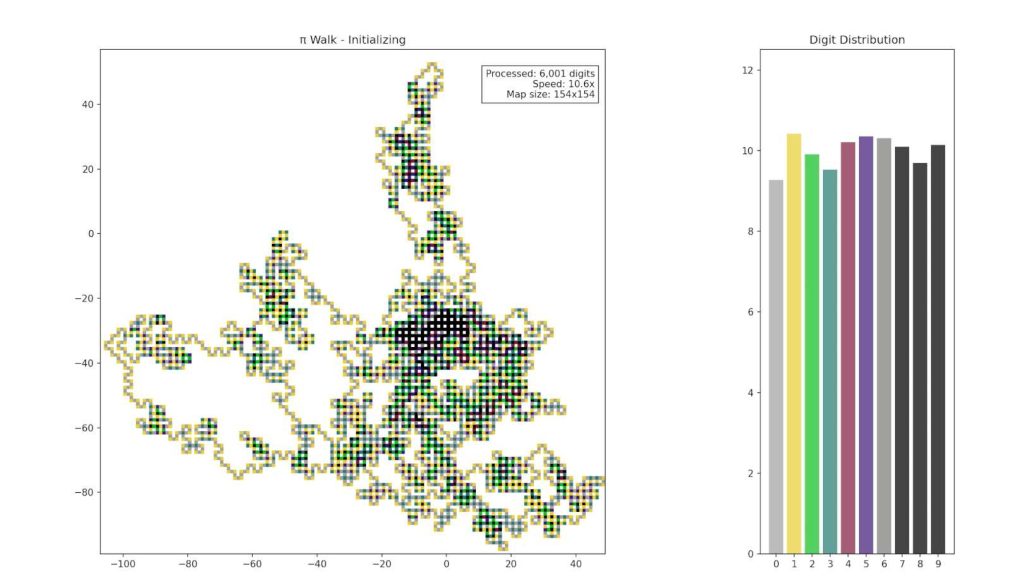
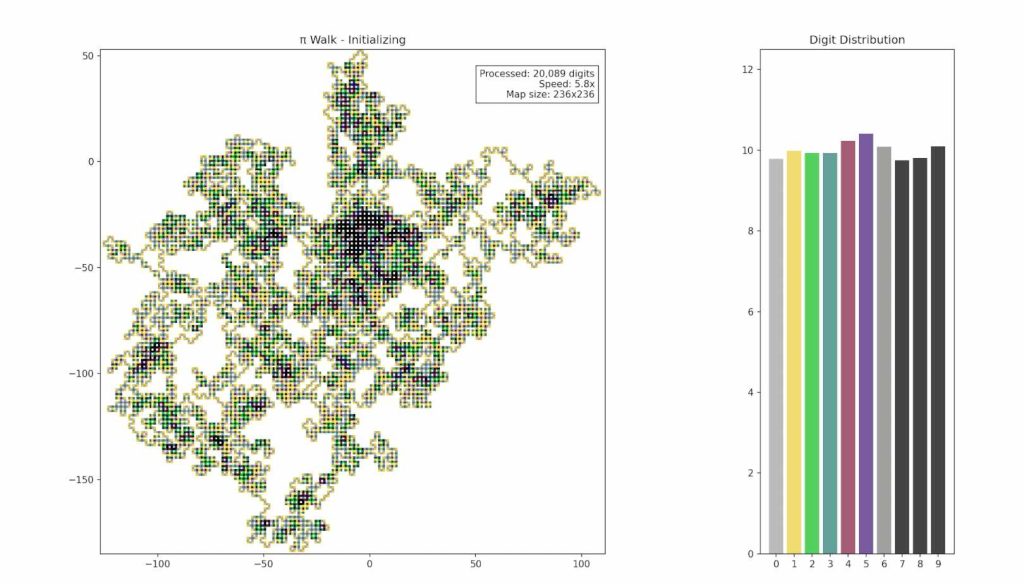
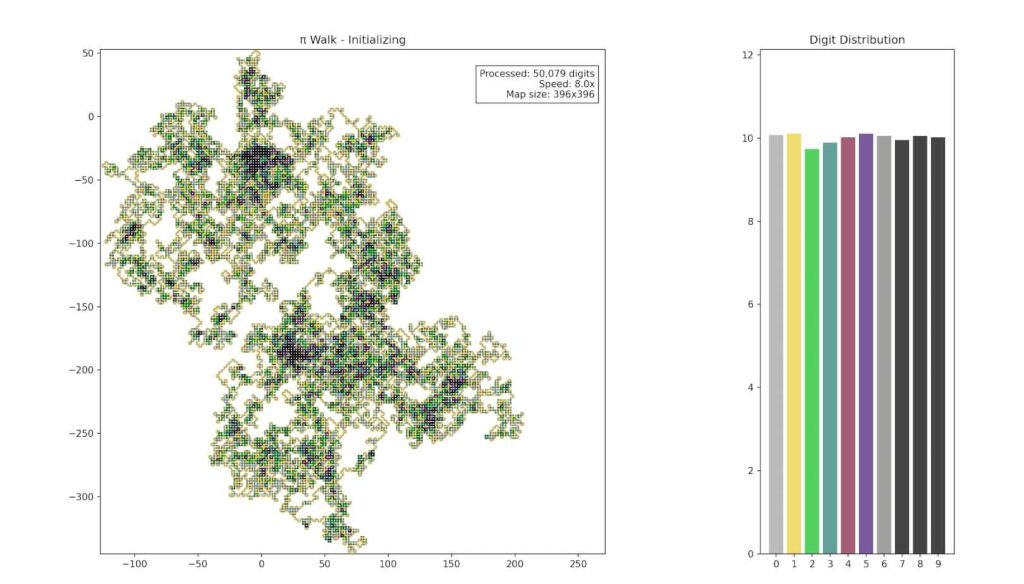
规则,起始方向向右,奇数左转,偶数右转,经过次数越多颜色越深。
预览:
代码结合AI写成。
使用方法,首先保存pi的前n位为pi.txt(去掉3.),放在下面的python文件的同级文件夹。记得安装引用的库。你也可以直接下载打包好的文件,包含主文件和pi.txt。
import numpy as np
import matplotlib.pyplot as plt
from collections import defaultdict
from matplotlib.animation import FuncAnimation
from matplotlib.widgets import Button
from matplotlib.patches import Rectangle

# 方向向量(初始向右)
directions = [
    np.array([2, 0]),   # 右
    np.array([0, -2]),  # 下
    np.array([-2, 0]),  # 左
    np.array([0, 2])    # 上
]

# 颜色映射
COLOR_MAP = {
    1: '#a5a5a3',  # 1次
    2: '#ebd03e',  # 2次
    3: '#1abf27',  # 3次
    4: '#2d7f77',  # 4次
    5: '#832443',  # 5次
    6: '#49207d',  # 6次
    7: '#7f7f7d',  # 7次
    8: '#010103'   # ≥8次
}
MAX_COLOR_LEVEL = max(COLOR_MAP.keys())


class PiVisualizer:
    def __init__(self, filepath):
        self.filepath = filepath

        # 初始化状态
        self.position = np.array([0, 0])
        self.dir_index = 0
        self.visit_counts = defaultdict(int)
        self.digit_counts = defaultdict(int)
        self.total_digits = 0
        self.patches = {}
        self.bars = None

        # 动态加速参数
        self.warmup_frames = 500       # 预热帧数
        self.current_batch = 1         # 当前批处理量
        self.speed_multiplier = 1.0    # 速度倍数

        # 初始化界面
        self.fig, (self.ax1, self.ax2) = plt.subplots(
            1, 2,
            figsize=(18, 9),
            gridspec_kw={
                'width_ratios': [3, 1],
                'wspace': 0.3
            }
        )
        self.setup_ui()
        self.pi_gen = self.read_pi_file()
        self.current_pi = next(self.pi_gen, '')
        self.pi_index = 0

        # 坐标跟踪
        self.min_x = self.max_x = 0
        self.min_y = self.max_y = 0

    def read_pi_file(self, chunk_size=100000):
        """循环读取π文件"""
        while True:
            with open(self.filepath, 'r') as f:
                while True:
                    chunk = f.read(chunk_size)
                    if not chunk:
                        break
                    clean_chunk = ''.join(c for c in chunk if c.isdigit())
                    if clean_chunk:
                        yield clean_chunk

    def setup_ui(self):
        """界面初始化"""
        # 主绘图区域
        self.ax1.set_aspect('equal')
        self.ax1.set_title('π Walk - Initializing')
        self.ax1.set_facecolor('white')

        # 信息显示
        self.info_text = self.ax1.text(
            0.98, 0.96, 'Processed: 0 digits\nSpeed: 1.0x',
            transform=self.ax1.transAxes,
            ha='right', va='top',
            fontsize=10,
            bbox=dict(facecolor='white', alpha=0.8)
        )

        # 统计区域
        self.ax2.set_ylim(0, 20)
        self.ax2.set_xticks(range(10))
        self.ax2.set_title('Digit Distribution')

        # 控制按钮
        btn_ax = plt.axes([0.01, 0.02, 0.1, 0.04])
        self.start_btn = Button(btn_ax, 'Start')
        self.start_btn.on_clicked(self.start_animation)

    def update_ranges(self, x, y):
        """动态更新坐标范围并保持正方形"""
        self.min_x = min(self.min_x, x)
        self.max_x = max(self.max_x, x)
        self.min_y = min(self.min_y, y)
        self.max_y = max(self.max_y, y)

        # 保持正方形显示
        size = max(self.max_x - self.min_x, self.max_y - self.min_y) or 1
        self.ax1.set_xlim(self.min_x - 1, self.min_x + size + 1)
        self.ax1.set_ylim(self.min_y - 1, self.min_y + size + 1)

    def update_plot(self):
        """严格的正方形绘图"""
        for pos, count in self.visit_counts.items():
            color = COLOR_MAP.get(
                min(count, MAX_COLOR_LEVEL), COLOR_MAP[MAX_COLOR_LEVEL])

            if pos not in self.patches:
                rect = Rectangle(pos, 1, 1,
                                 color=color,
                                 edgecolor='black',
                                 linewidth=0.3)
                self.ax1.add_patch(rect)
                self.patches[pos] = rect
            else:
                self.patches[pos].set_color(color)

    def update_stats(self):
        """更新统计图表"""
        if not self.bars:
            self.bars = self.ax2.bar(range(10), [0] * 10,
                                     color=[COLOR_MAP.get(
                                         i + 1, '#010103') for i in range(10)],
                                     alpha=0.7)

        total = sum(self.digit_counts.values()) or 1
        percentages = [self.digit_counts[d] / total * 100 for d in range(10)]
        for bar, h in zip(self.bars, percentages):
            bar.set_height(h)
        self.ax2.set_ylim(0, max(percentages) * 1.2)

    def process_digits(self, batch_size):
        """处理数字逻辑"""
        for _ in range(batch_size):
            if self.pi_index >= len(self.current_pi):
                self.current_pi = next(self.pi_gen, '')
                self.pi_index = 0

            digit = int(self.current_pi[self.pi_index])
            self.pi_index += 1
            self.total_digits += 1
            self.digit_counts[digit] += 1

            new_pos = self.position + directions[self.dir_index]
            steps = np.linspace(self.position, new_pos, num=3, dtype=int)

            for step in steps:
                pos = tuple(step)
                self.visit_counts[pos] += 1
                self.update_ranges(*pos)

            self.dir_index = (self.dir_index - (digit % 2) * 2 + 1) % 4
            self.position = new_pos

    def animation_frame(self, frame):
        """动画帧更新"""
        # 动态加速曲线
        if frame < self.warmup_frames:
            # 预热阶段:缓慢加速
            self.current_batch = 1 + int(frame / 20)  # 前100帧从1逐步增加到6
            self.speed_multiplier = 1.0 + frame * 0.02
        else:
            # 正常阶段:平方根加速
            progress = (frame - self.warmup_frames) ** 0.5
            self.current_batch = min(200, 1 + int(progress * 5))
            self.speed_multiplier = min(20.0, 1.0 + progress * 0.3)

        self.process_digits(self.current_batch)
        self.update_plot()
        self.update_stats()

        # 更新信息显示
        map_size = max(
            self.max_x - self.min_x,
            self.max_y - self.min_y
        ) or 1
        self.info_text.set_text(
            f'Processed: {self.total_digits:,} digits\n'
            f'Speed: {self.speed_multiplier:.1f}x\n'
            f'Map size: {map_size}x{map_size}'
        )
        return [self.ax1.patches, self.ax2.patches]

    def start_animation(self, event):
        """启动动画"""
        self.start_btn.label.set_text('Running')
        self.anim = FuncAnimation(
            self.fig,
            self.animation_frame,
            frames=range(100000),  # 足够大的帧数
            interval=50,          # 固定刷新率
            blit=False,
            cache_frame_data=False
        )
        plt.show()


# 使用示例
if __name__ == "__main__":
    visualizer = PiVisualizer('pi.txt')
    plt.show()